Ensmart
Monitoring Services
Take control of
your Energy Consumption
YOU CAN GET ACCESS TO THE EMS ANYWHERE ANYTIME WITH
On-Cloud & On-Premise
EnSmart is that one product you need for an accurate management for solutions regarding energy and power at all condition.
Easy Installation
With our standalone software, configure your platforms with simple steps and connect to the system.
Analysis & Reporting
Access to a wide variety of reports analysis modules and easily generate, store reports in just a few clicks.
Cloud-based
All the data are stored in cloud. It is safe and secure, also provides unlimited historical data storage.
Energy Dashboards
Customizable dashboards, handle multiple remote sites within a single portal with ease.
Fault Detection
EnSmart tool provides notifications on each anomaly, easily identify faults and take pre-emptive measures.
Alarm/Notifications
Get alerts via texts, e-mails when given level drops below a threshold or leaves specific points or at even more complex conditions.
Manage your energy consumption in 4 steps
- Live and Instantaneous view of energy consumption: Software provides information to make instantaneous decisions that can immediately make a positive impact on the production and energy consumption.
- Setup Auto Alerts: Auto Alerts helps plants to act immediately when there is an energy over-consumption event so that the production losses and damages can be reduced or avoided.
- Monitor equipment performance: Helps you to understand the machine’s efficiency by comparing
-
- Turn energy into a managed expense: Understand the impact of energy on profitability and integrate production plans with energy procurement.
- Forecast revenue, expenses, and profits with more accuracy: Use historical energy consumption data to predict and manage future consumption.
- Take proactive steps towards energy management and corporate social responsibility: Reduce site impact on the environment by minimizing energy waste.
-
- State-of-the-art technology ensuring quality, performance, compatibility, and value.
- Compares consumption profiles to design more efficient processes.
- Optimizes your company according to energy parameters based on an evaluation of consumption and costs.
- Exporting data to Excel
- Ingrates with any Third-party device.
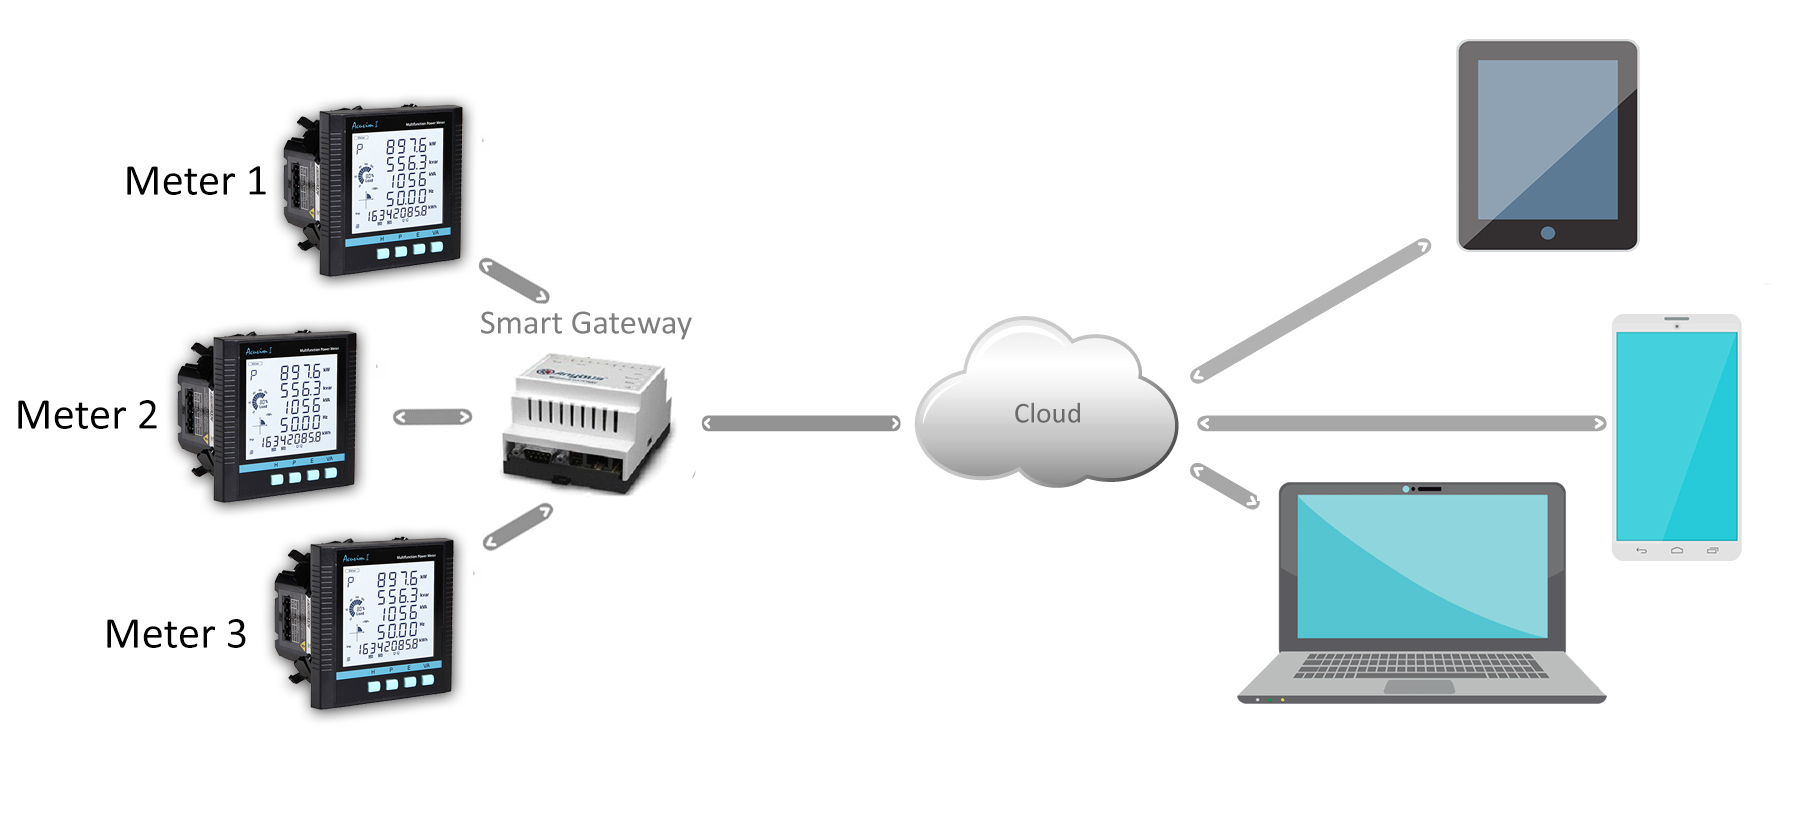
Ensmart – MS Schematic
Portal
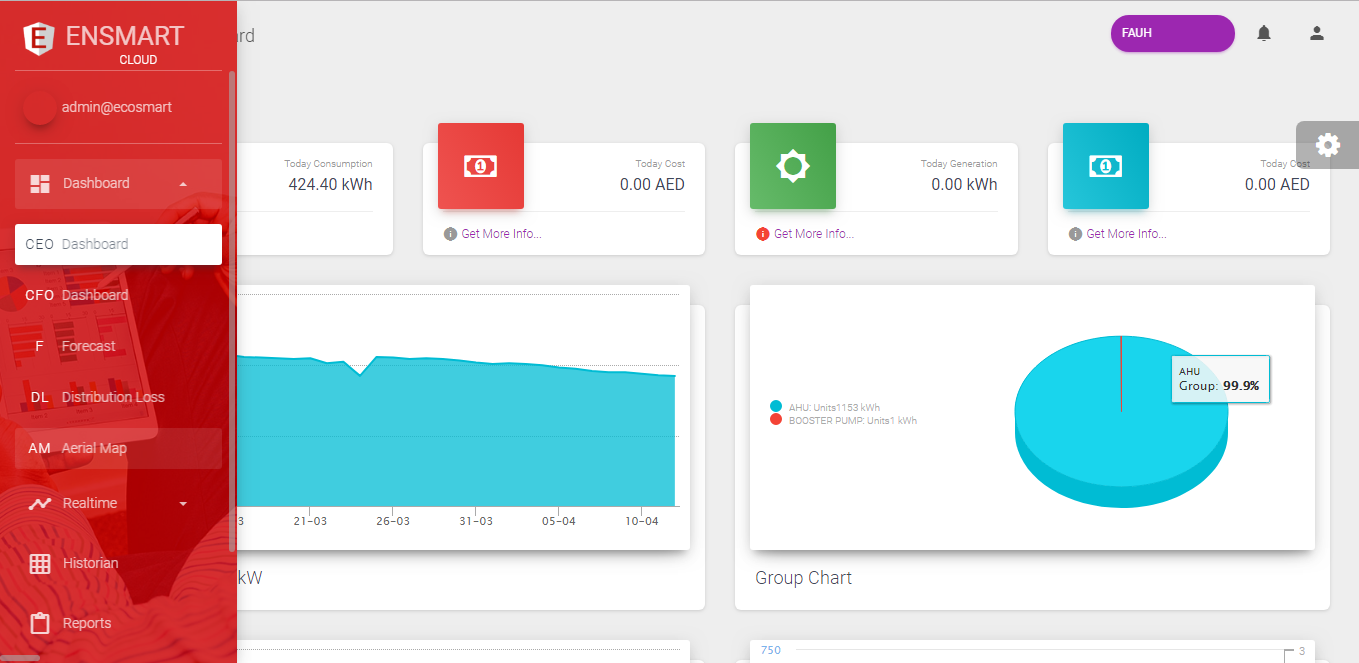
EnSmart Dashboard collects information from various field devices and systems so that energy consumption can be tracked against dynamic energy targets. The dashboard is completely tailored to every individual customer.
- Separate Dashboards are available to track production, cost & consumption.
- Personalised Dashboard for CEO – Helps CEO to track the consumption Vs Production & assists to price the product accurately.
- Personalised Dashboard for CFO – Helps CFO to track the production Vs Cost Vs Consumption and assists to take the right decision on energy trading.
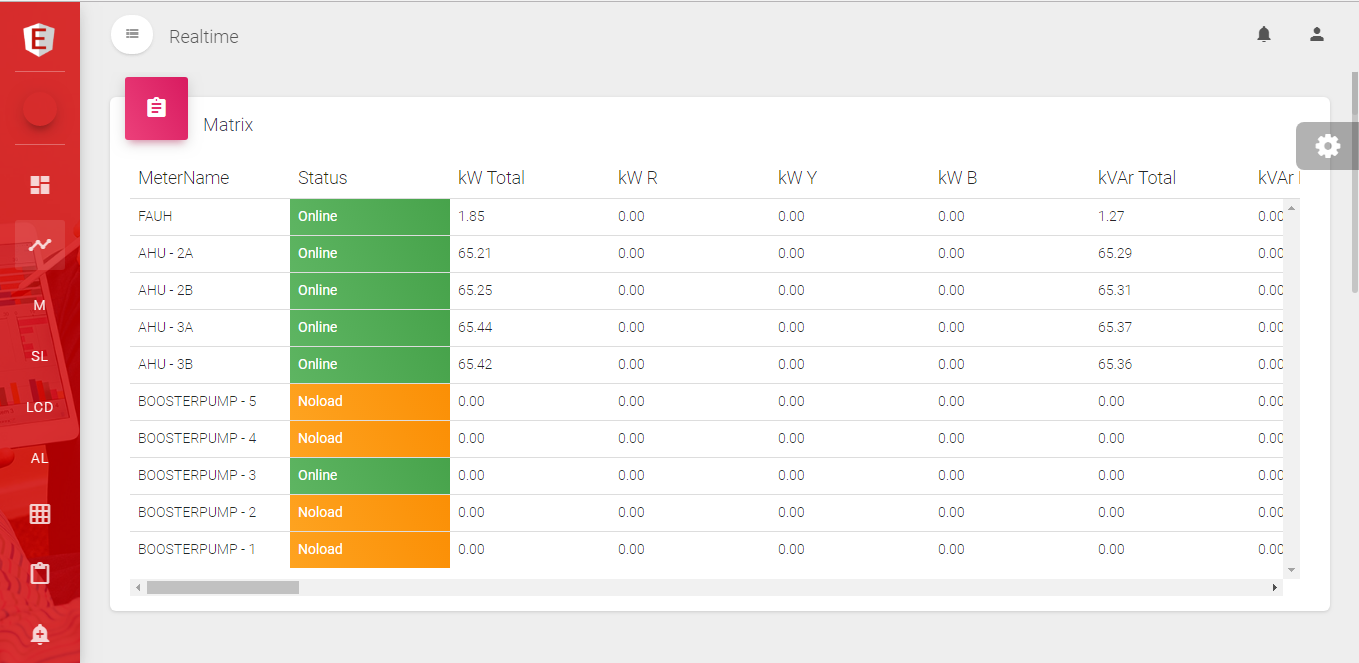
Real-time window helps the user to monitor their live and instantaneous parameters. The following information will be available in this window.
- Live parameters in a Tabulated form.
- Live parameters in As build drawing.
- Live parameters of selected devices & its trending.
- Live parameter in Analog & Digital form.
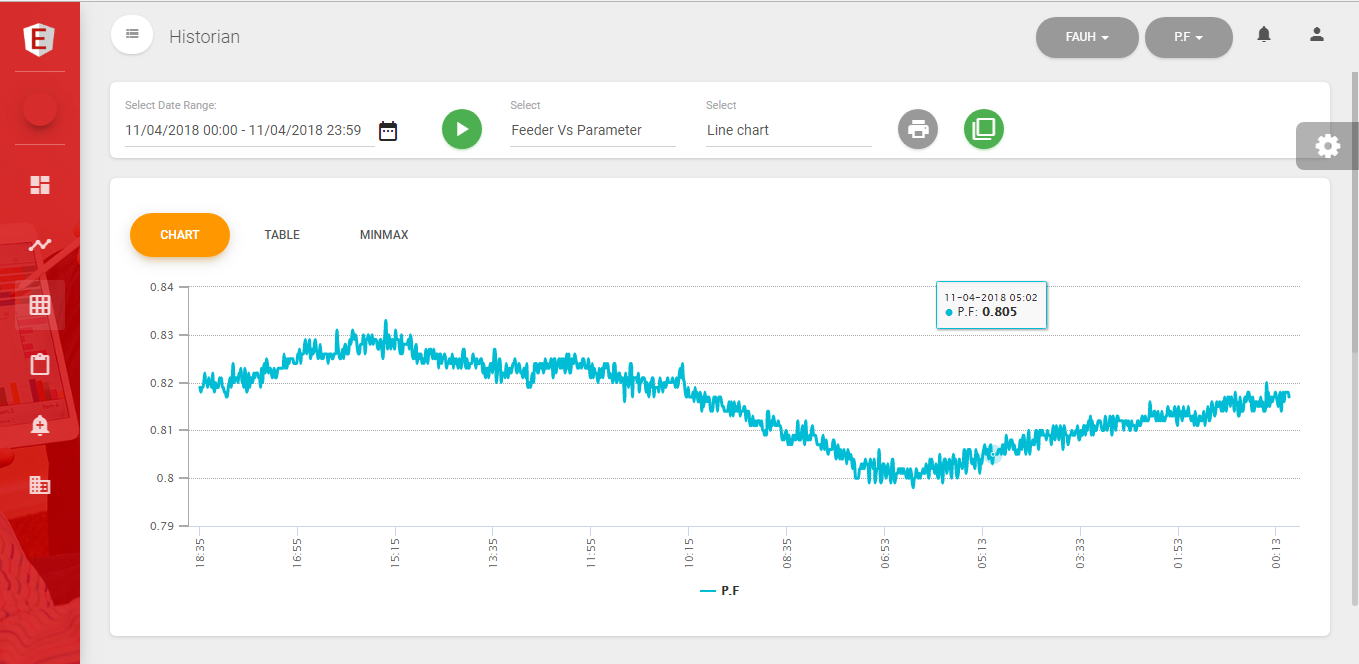
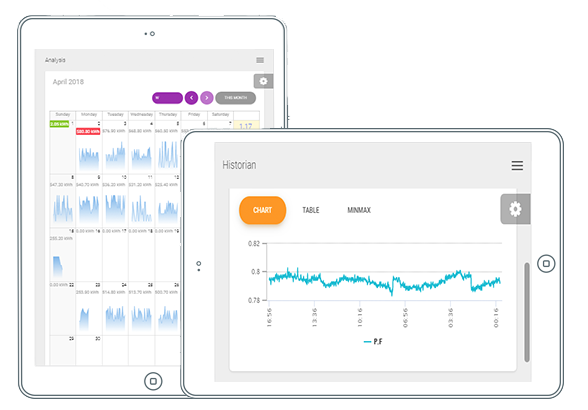
Historian window helps the user to download their historical data. This helps us to understand the consumption pattern and load analysis. Following are the type of historical data we can download from this window.
- Min-Max value of all devices during a specific time period.
- Feeder Vs Parameter details during a specific time period.
- Parameter Vs Feeder details during a specific time period.
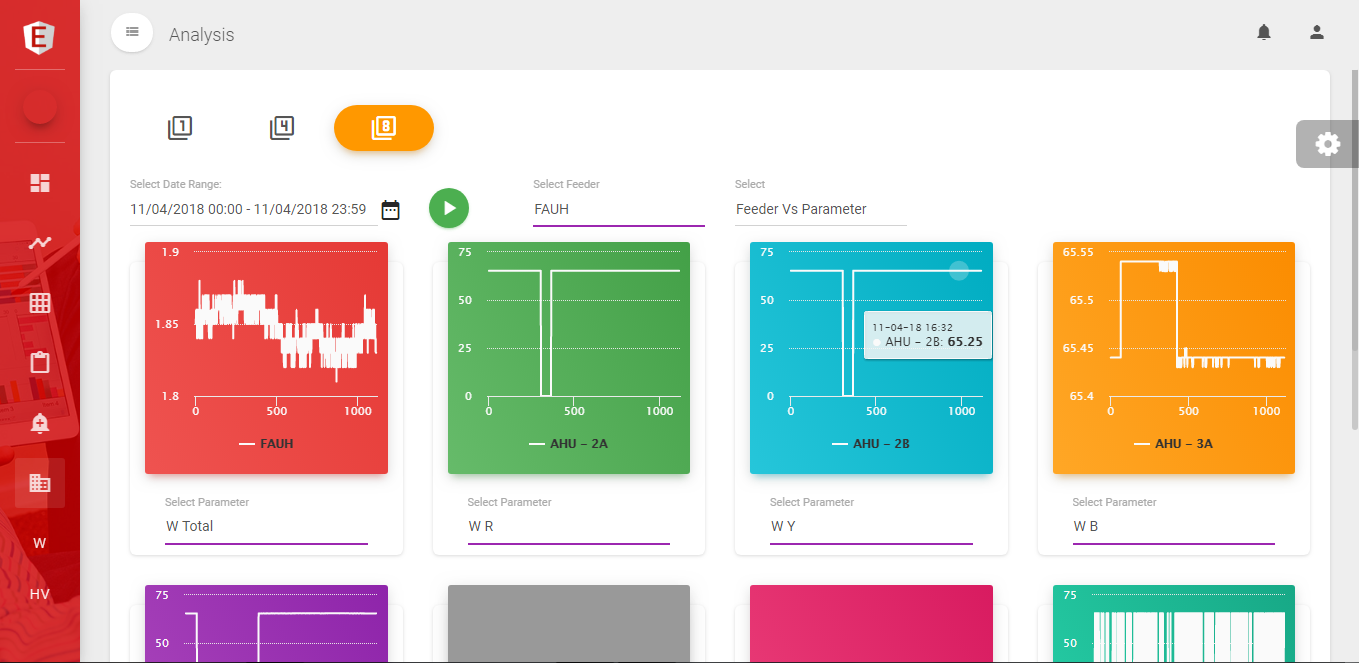
Analysis window helps us to analyze the critical parameter of the loads and gives us accurate information about the efficiency loss and energy loss of every load. The following analysis can be done using this module.
- Compare the critical parameter of a load with other 4 or 8 loads to understand the load variation.
- Hook View – helps us to Minimum & Maximum energy consumption of the day, week & month.